Tracking the performance of your Google Ads is critical to success. Years ago, marketers struggled to measure the impact of traditional advertising campaigns. Nowadays, we’re drowning in metrics and key performance indicators (KPIs).
It’s easy to get confused. Industry jargon like CPC, CTR, or CPA can leave you baffled – insights get lost in the noise.
You can’t afford to ignore Google Ads KPIs. After all, you’re spending money for every ad; you want to maximise your profit relative to your ad spend.
Below I’ll break through the jargon, explaining what the main Google Ads KPIs are – and what you need to look for when monitoring each one. With this guide, you can boost your ads performance and save money in the process.
Here’s how.
What are the Key Google Ads KPIs?
When you log in to analyse your Google Ads campaigns, you’re bombarded with a myriad of metrics. It’s all a little disorientating. What does it all mean? And what’s good and bad?
In a nutshell, there are ten key Google Ads metrics and KPIs you need to monitor:
- Number of Clicks
- Number of Impressions
- CTR
- CPC
- Target CPA
- Conversion Rate
- ROAS
- Search Impression Share
- Search Lost IS (rank) and Search Lost IS (budget)
- Quality Score
Let’s go through each one – explaining what it is and why it matters.
1. Number of Clicks
The simplest Google Ads metric is the number of clicks your ad has received in a given time. You’d be forgiven for thinking more clicks are better – that’s the point, right? Wrong! As you’ll see, it’s all about the quality of the clicks you receive. Think about it – clicks are like customers walking into a shop. If everyone going into the butchers actually wants the florist, they’re not worthwhile customers.
2. Number of Impressions
An impression is when your ad is shown. Like clicks, you can’t convert customers without your ad being seen. But what matters is who it is being seen by. For instance, your impressions could go down, despite your overall sales going up.
I know; it sounds counterintuitive.
3. Click-Through Rate (CTR)
Your CTR is the ratio of impressions to clicks. It’s a critical metric. Ideally, you want to maximise your CTR – but you also want to optimise who sees your ad first. If almost everyone who sees your ad is interested in your product but doesn’t click – you’ve got a problem.
Look for your CTR to increase.
4. Cost per Conversion (CPC)
Your CPC, or cost per acquisition, is mostly relevant for non-eCommerce businesses. It’s the amount you’re spending on ads relative to leads. You want this Google Ads metric to be as small as possible. The less you spend on ads per lead, the greater your overall profit margin.
If you’re spending a lot, it means people are clicking your ad who don’t want to buy – you need to figure out why. In a nutshell – the average cost per conversion should be way less than the profit you make from the client.
5. Target CPA
Target CPA (target Cost Per Acquisition) is a Google Ads strategy where the system automatically “finds an optimal bid for your ad each time it’s eligible to appear.” – according to Google.
The pros of such an approach mean you save money by not bidding on keywords with little benefit. However, it’s generally more beneficial for B2C companies, which can more readily monetise conversions.

6. Conversion Rate
Your conversion rate is the ratio of clicks to conversions. It’s similar to the CPC – but is expressed as a percentage rather than a monetary amount. You want to maximise this figure. The more clients you convert relative to the number of clicks will lower your overall Ad spend as a proportion of your profit.
A very low conversion rate is around 0.1 to 0.5%, meaning only .05% of users who clicked on your ad bought your product. It’s essentially your return on investment (ROI).
You’ll want to see what your conversion rate from other traffic sources are to see how your Google Ads campaign compares. For example, traffic from organic Google and direct visits usually always has a higher conversion rate. But your Google Ads shouldn’t be far behind. If your average across all channels is 0.5% and your Google Ads is 0.3%, then that’s something to work on.
7. Return on Ad Spend (ROAS)
ROAS (return on ad spend) exclusively applies to eCommerce businesses. It should be top of your list when analysing PPC success.
To calculate ROAS is simple:
The average value of each conversion (say $5,000) is divided by the average cost per conversion (say $400). So, in this case, the ROAS will be (5,000/400) 12.5 – or for every $1 spent on Google Ads, we generate $12.5 in revenue.
You can see how it’s so valuable. Try to maximise your ROAS – that means more profit in the bank.
8. Search Impression Share
Your Search Impression Share is the ratio of the number of impressions you received relative to the total number of impressions available. In short, it’s how well your ad is performing compared to your competitors. It depends on three metrics:
- The more available to spend, the more likely you will be seen.
- Quality score. Your keyword relevancy score. Higher scores mean a greater impression share without bidding more.
- Your bid will determine whether you’re shared or not – leading to more or fewer impressions.
9. Search Lost IS – Rank and Budget
You can further analyse your Search Impression Share with your Search Lost (IS). It breaks down into two components:
- Search Lost (IS) Rank. The percentage of times your ad didn’t appear due to low ad rank, i.e., your quality score.
- Search Lost (IS) Budget. The percentage of times your ad didn’t appear due to low budget.
It tells you what you need to change to receive more impressions. Either increase your overall daily or monthly budget or work on your ad’s quality score.
10. Quality Score
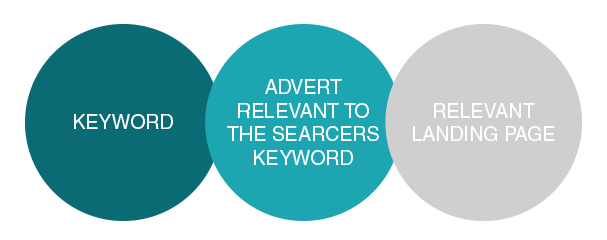
Often overlooked, your Quality Score can significantly lower the costs of your ad. It is calculated based on how reliable your company is in showing users relevant information. If someone searches for “lawnmowers” but your ad is for hedge trimmers – your quality score will drop.
Quality scores are graded one to ten – with five being average. Low-quality scores mean you pay more to maintain an ad relative to your chosen keywords.
Hopefully, this has cleared up any confusion in terms of what you should be looking at and why. Even if you outsource your Google Ads campaign to an agency or consultant, it’s important you understand the key metrics, so you know whether or not your campaigns are improving and performing well.

Victoria regularly shares her insights about the latest Google Ads trends and practical tips. Drawing from her 15 years of direct experience, her writings are a blend of seasoned expertise and genuine passion for the field. Apart from her engaging articles, Victoria is an active voice on LinkedIn, discussing Google Ads and is a recognised contributor in prominent PPC communities online.
If you're keen to delve into the nuances of Google Ads or general marketing insights, connecting with Victoria on LinkedIn is a good shout.
- How to Do Keyword Research for Google Ads - January 15, 2024
- A Comprehensive Guide to Google Ads for B2C Businesses - January 8, 2024
- How to Write Calls to Action (CTAs) for Google Ads - December 25, 2023